
Identifying Strength in Recessionary Market Conditions
Run a screen in a downturn and it hands back the same shape every time: trading below asset value, strong balance sheet, negative trailing returns, maybe a capable owner-operator buying stock. Some of those businesses are about to take share they never give back. Others are already dead and simply haven't finished falling. The dashboard is identical.
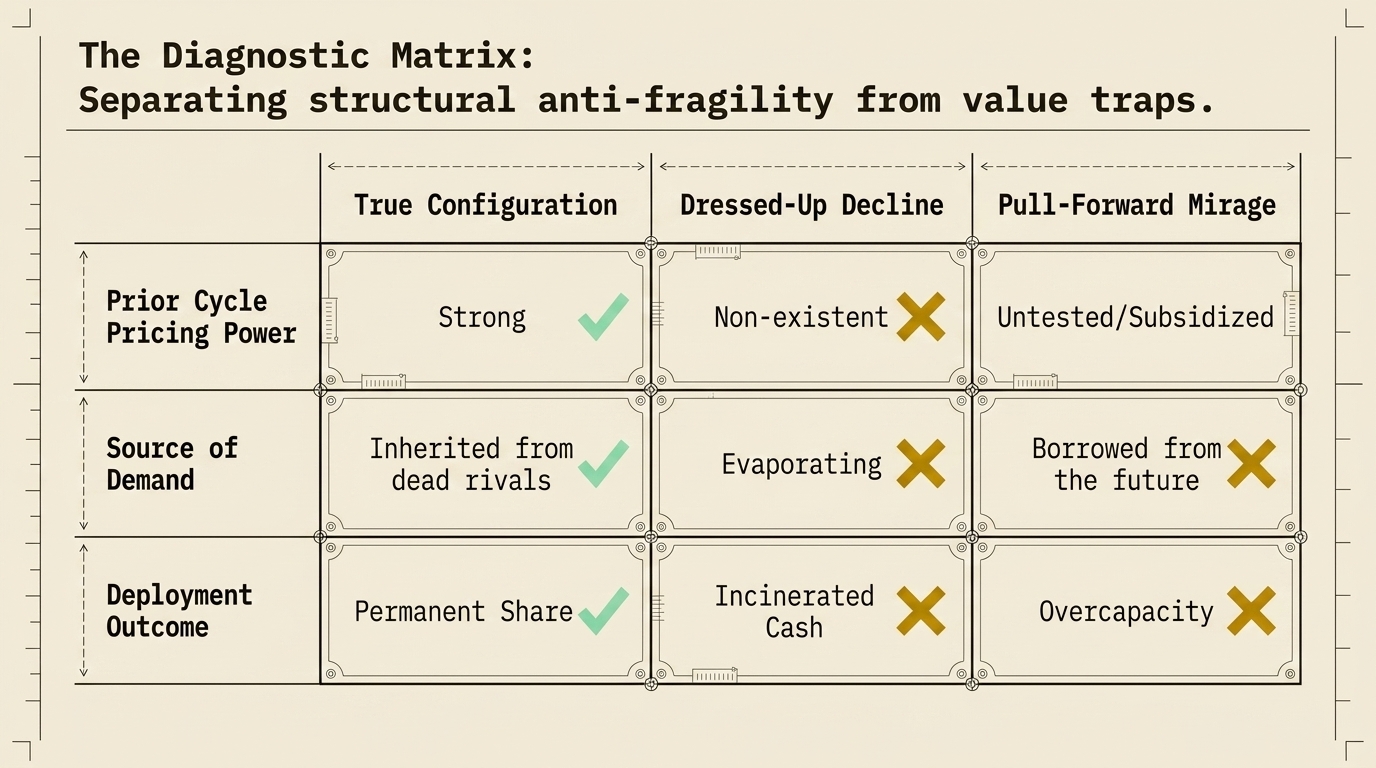
The orthodoxy is backwards. Balance-sheet strength is usually read as defensive — insurance, and insurance costs return. For a specific configuration of firm, a crisis is the highest-return operating environment it will ever see. Opler and Titman documented the losing side: highly levered firms in distressed industries lose substantially more sales than conservative peers, and when a weak competitor exits outright, the survivors inherit its pricing power at zero acquisition cost.
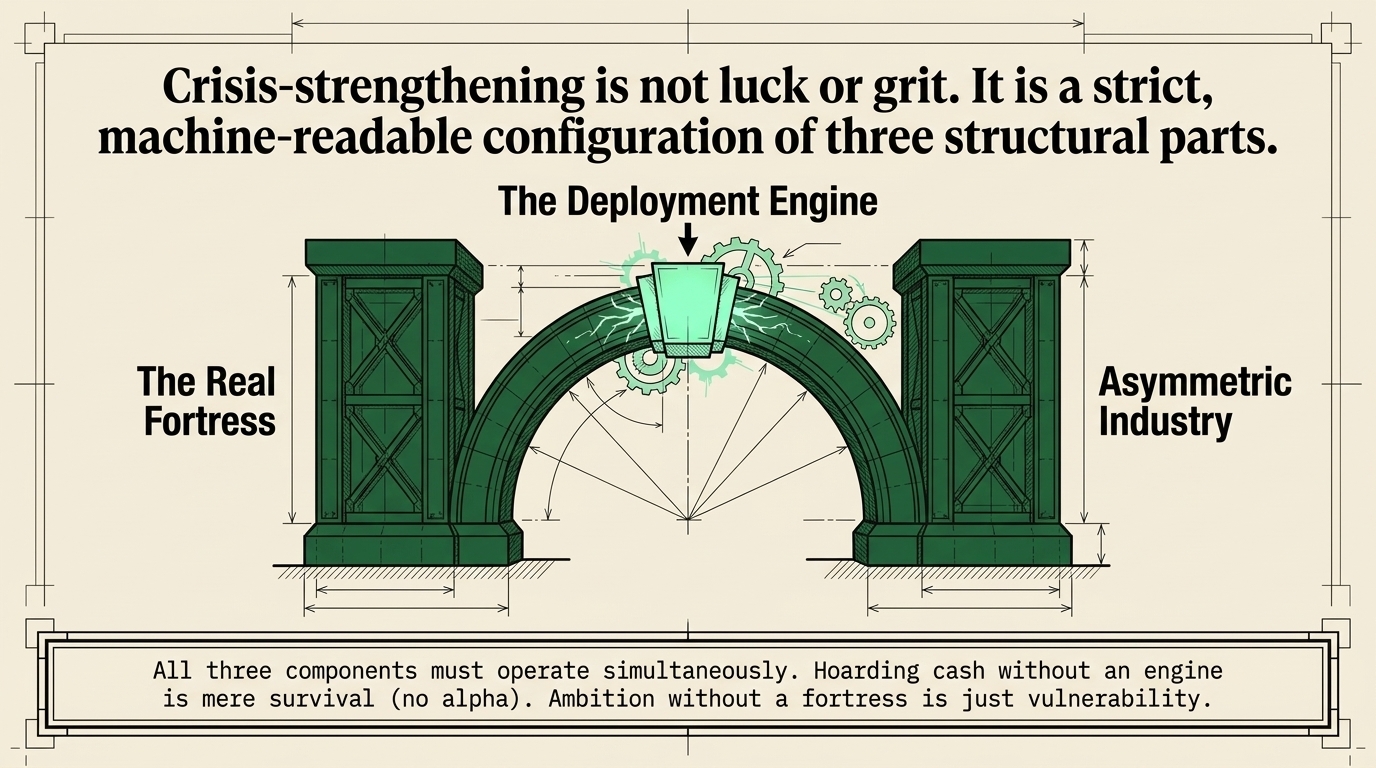
Three parts, and they only pay together. A real surplus — not "manageable" leverage, an actual one, because carrying too little debt costs a little every year while carrying too much costs catastrophically once. A deployment engine, because strength that cannot act is a parked asset and the dislocation windows are weeks, not years. And an industry where the downturn bites rivals harder than you: a crisis in which everyone is a fortress transfers nothing.
A fortress with no engine is survival without the alpha. An engine with no fortress is ambition without ammunition.
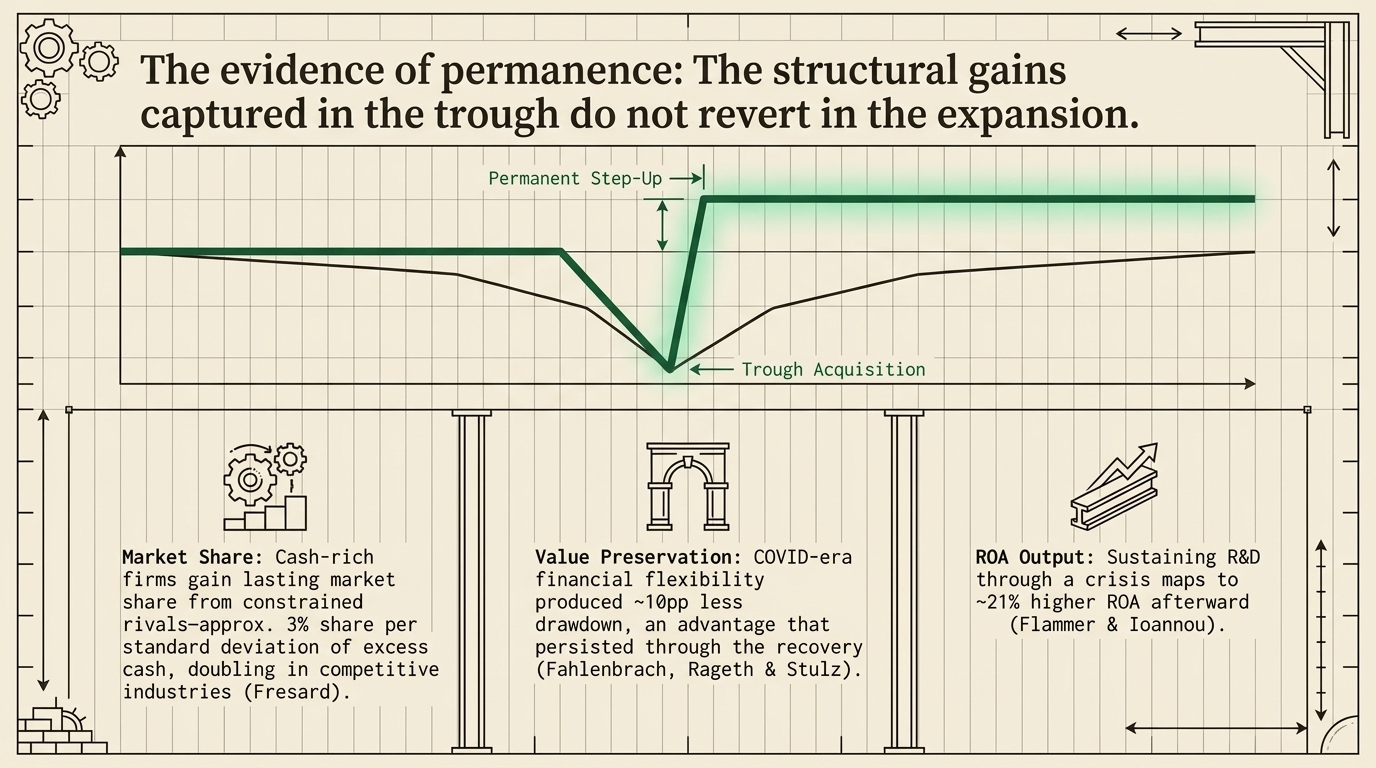
The gains don't revert. Fresard found cash-rich firms take lasting share from constrained rivals — several points per standard deviation of excess cash, roughly twice that in competitive industries — and the share stays put through the recovery. Fahlenbrach, Rageth and Stulz measured materially smaller drawdowns for financially flexible firms through COVID, an advantage that persisted into the rebound. Flammer and Ioannou found that sustaining R&D through the crisis mapped to meaningfully higher returns on assets afterward.
The crisis doesn't create the advantage. It transfers advantage, at forced-sale prices, from the fragile to the prepared.
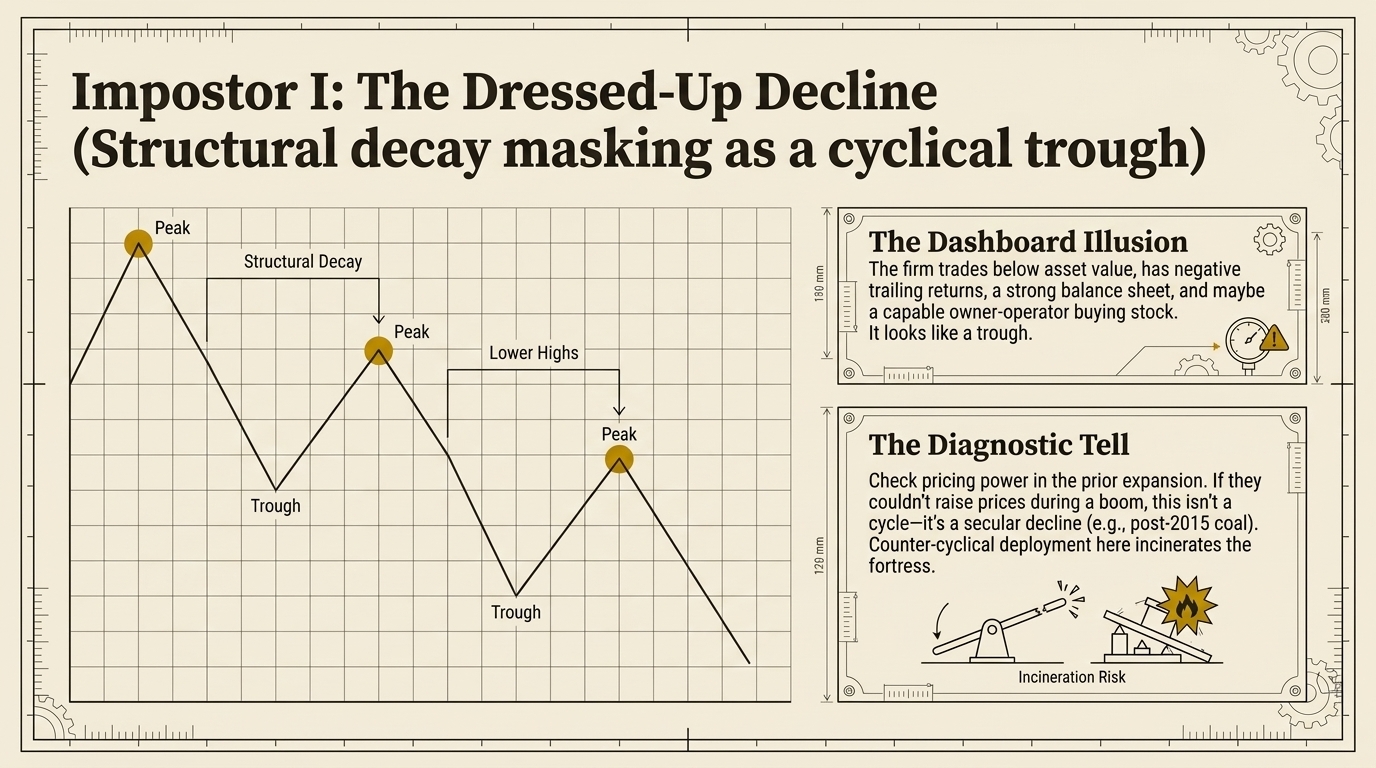
Impostor I: the dressed-up decline. Structural decay at a cyclical-looking trough presents the identical dashboard. The discriminator isn't anything in the present — it's the last expansion. If the business couldn't raise prices during the boom, this isn't a cycle, it's a staircase down; post-2015 coal printed every trough lower than the one before. Counter-cyclical deployment into a secular decline doesn't transfer advantage. It incinerates the fortress.
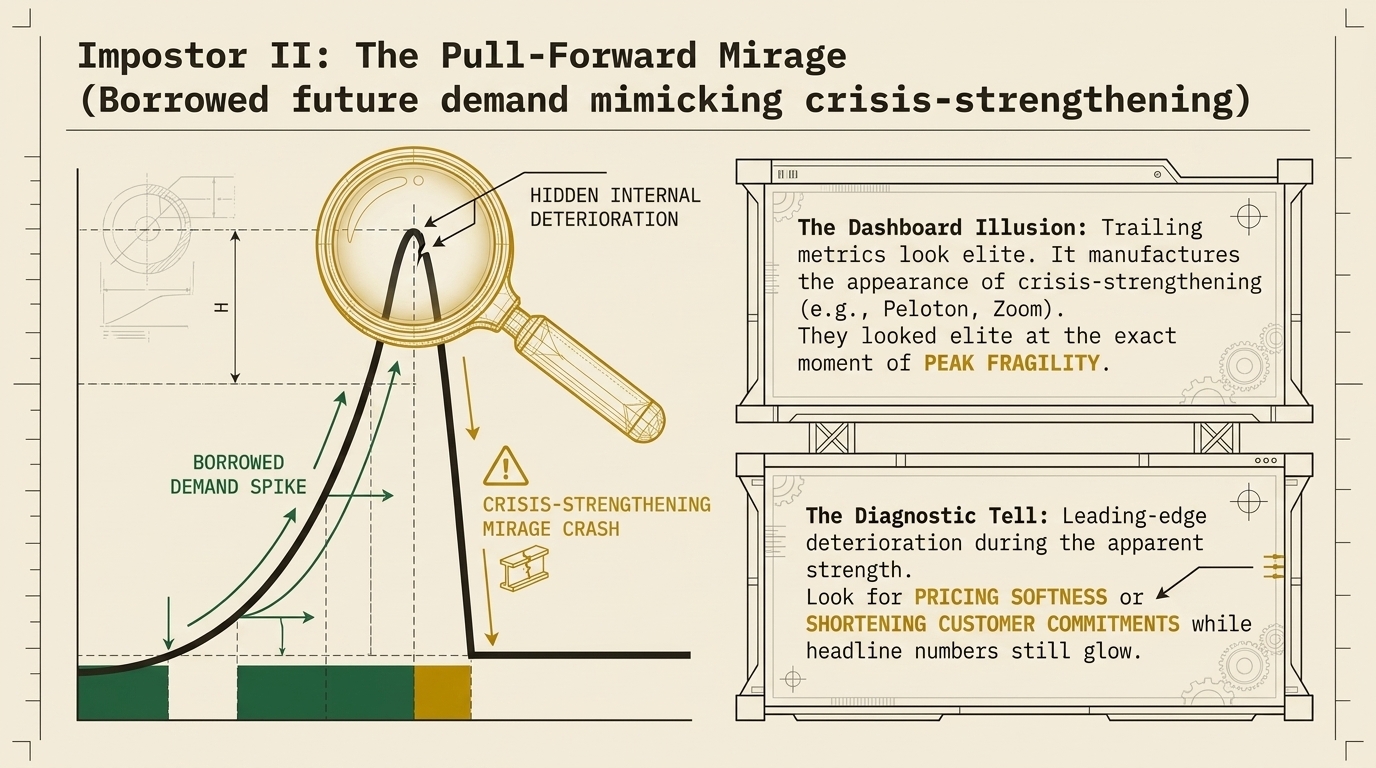
Impostor II: the pull-forward mirage. Crisis-era demand borrowed from the future manufactures the appearance of crisis-strengthening — trailing metrics look elite precisely because tomorrow's demand is being consumed today. Peloton and Zoom looked like textbook crisis winners at the exact moment they were at peak fragility. The tell is leading-edge deterioration while the headline numbers still glow: pricing softness, or customer commitments quietly shortening.
A note on method: below-asset-value and trailing-return readings are backward-looking by construction — they describe what already happened, not what a business is becoming, and neither impostor is caught by waiting for a cheaper price. In both cases the discriminator is forward-looking: pricing power in the prior expansion, and the direction of customer commitments during apparent strength.
Sources
Fresard, "Financial Strength and Product Market Behavior" (Journal of Finance, 2010); Fahlenbrach, Rageth & Stulz, "How Valuable Is Financial Flexibility When Revenue Stops?" (Review of Financial Studies, 2021); Opler & Titman, "Financial Distress and Corporate Performance" (1994); Flammer & Ioannou (crisis-era investment persistence); Meier & Servaes (fire-sale acquisitions); Coval & Stafford, "Asset Fire Sales in Equity Markets" (2007); Chancellor, Capital Returns (Fastenal, the capital cycle); Thorndike, The Outsiders (Singleton's trough tenders); Graham & Dodd, Security Analysis (net-current-asset survivorship).
Not AI-generated signals.
Get the next piece by email.
One email when new research publishes. No spam, no tipsheet.
One email when a new piece publishes. No spam.
Published 26 Jul 2026 and not revised since. Informational only — not investment advice or a recommendation. Corrections: research@863labs.com.