
How to Evaluate Management as Capital Allocators
Franchise economics tell you what a business earns. They tell you nothing about what happens to the money next — and over a holding period measured in years, the second question dominates the first. Two identical franchises diverge by 10x over a decade for one reason: who allocates the cash.
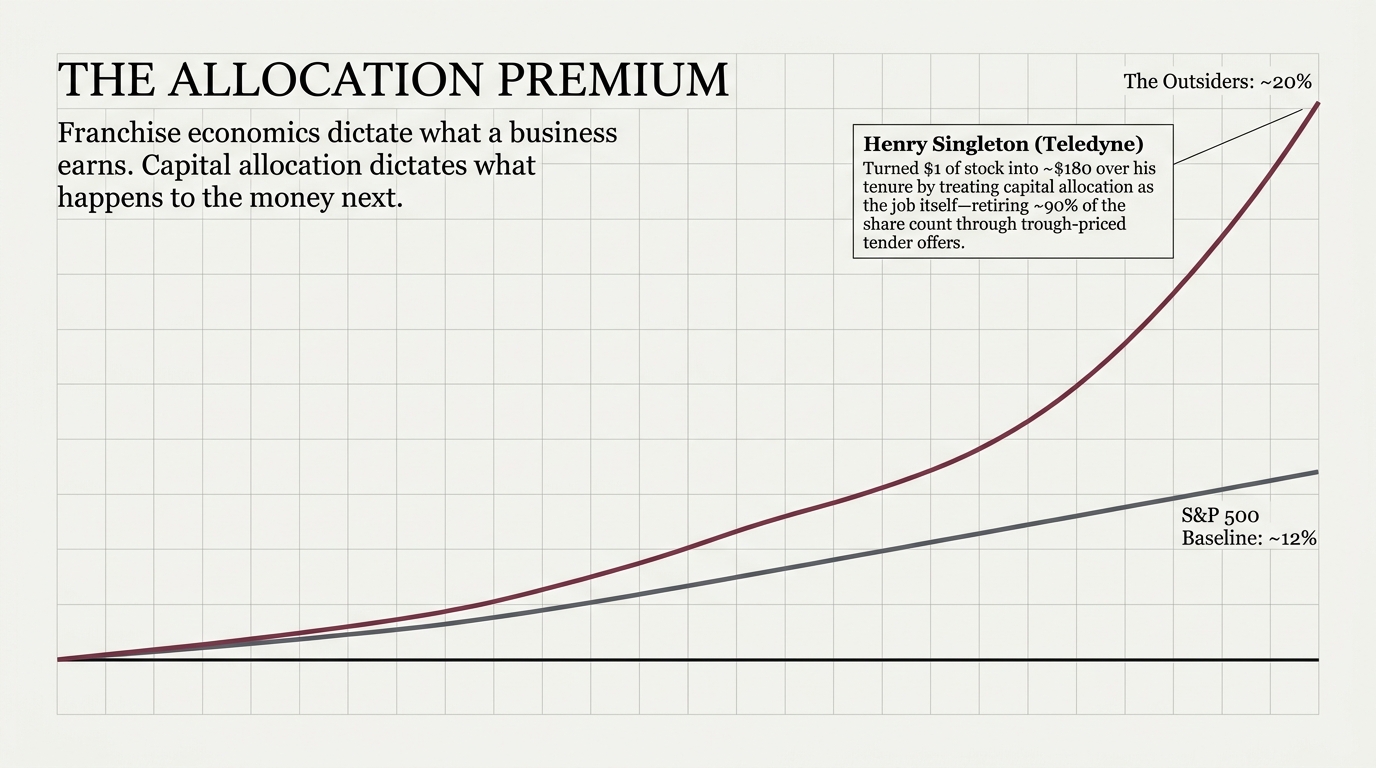
The cleanest evidence is Thorndike's. Eight CEOs who treated capital allocation as the job itself compounded at roughly 20% a year against 12% for the S&P 500 — and the entire spread is allocator discipline applied to ordinary franchise economics, not better businesses. The individual records are staggering. Henry Singleton turned a dollar of Teledyne stock into about $180 over his tenure, retiring some 90% of the share count, much of it through tender offers launched at price-to-earnings troughs. Tom Murphy compounded Capital Cities at about 19.9% for 29 years. The pattern generalizes: Fahlenbrach found founder-CEO firms carry a measurable annual alpha, driven by owners deploying their own money.
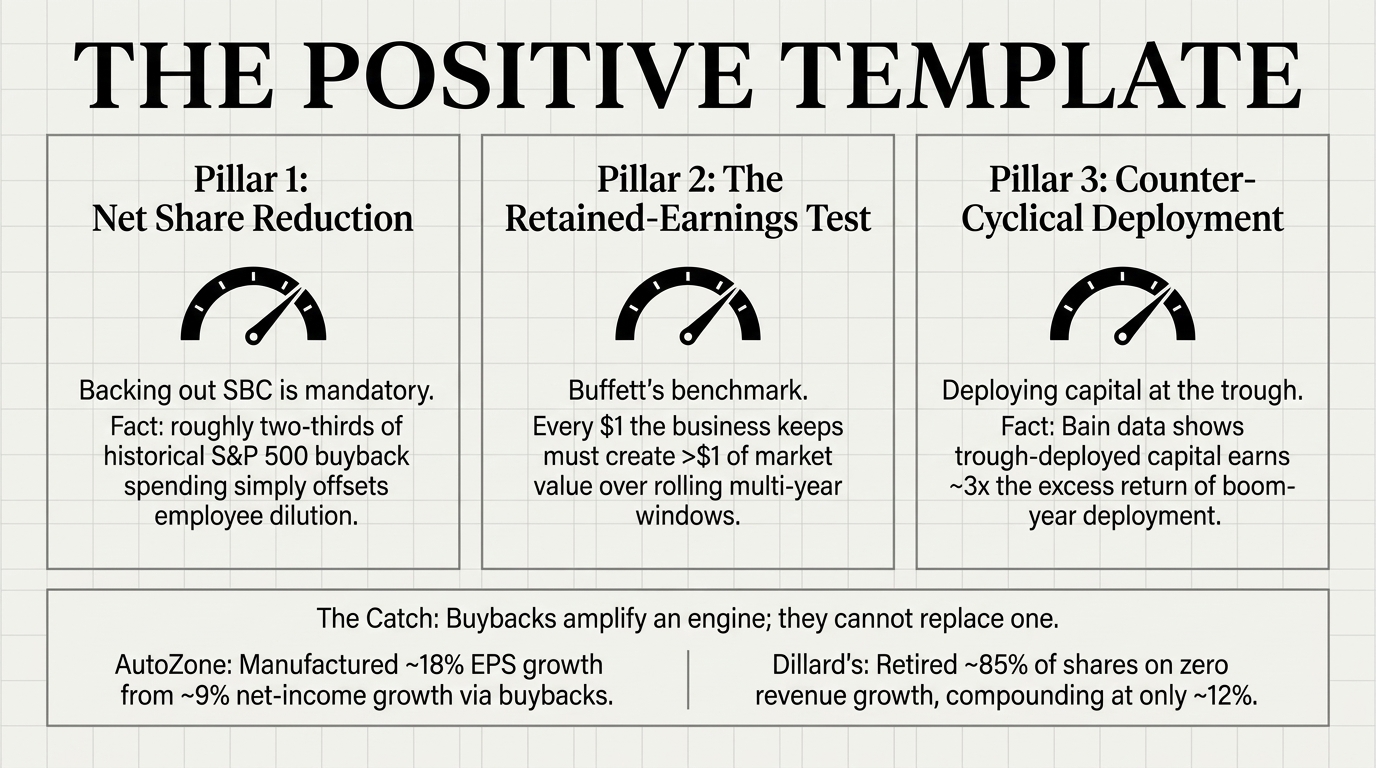
Great allocators share three observable behaviors. They shrink the share count net of stock compensation — which matters because roughly two-thirds of S&P 500 buyback spending historically just offsets employee dilution, making gross buyback headlines close to meaningless. They pass Buffett's retained-earnings test: every dollar the business keeps should create at least a dollar of market value over rolling multi-year windows. And they deploy counter-cyclically — Buffett put $15.6B to work in the 25 days after Lehman failed, and trough-deployed capital has historically earned on the order of three times the excess return of boom-year deployment. The buyback records show the ceiling and the catch together: AutoZone manufactured about 18% EPS growth from about 9% net-income growth through relentless repurchases, while Dillard's retired roughly 85% of its shares against zero revenue growth and still compounded at only about 12%. Buybacks amplify an engine. They cannot replace one.
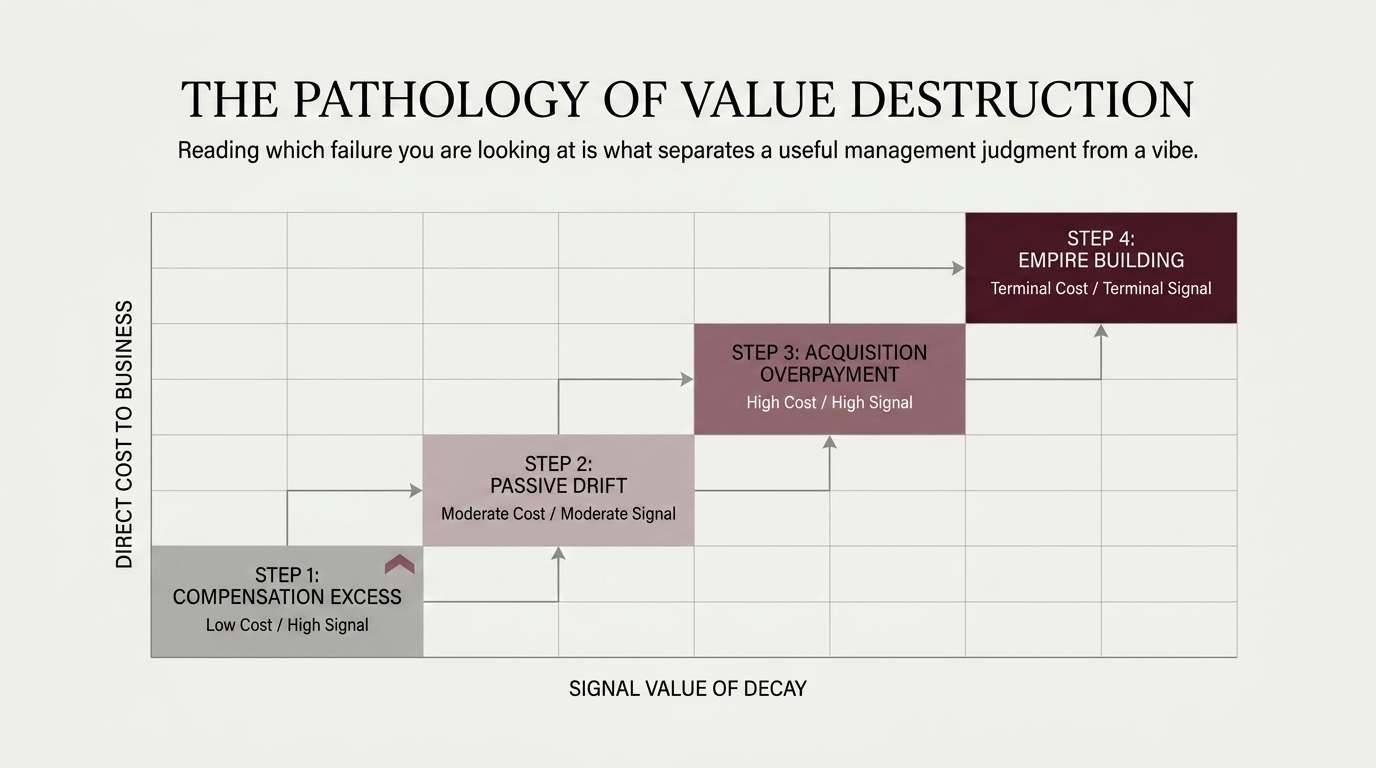
The mistake most investors make is treating management quality as one dial from good to bad. Allocators fail in distinct, identifiable modes, and the modes carry different costs, different tells, and different trajectories. Reading which failure you are looking at — not merely whether something is off — is what separates a useful management judgment from a vibe.
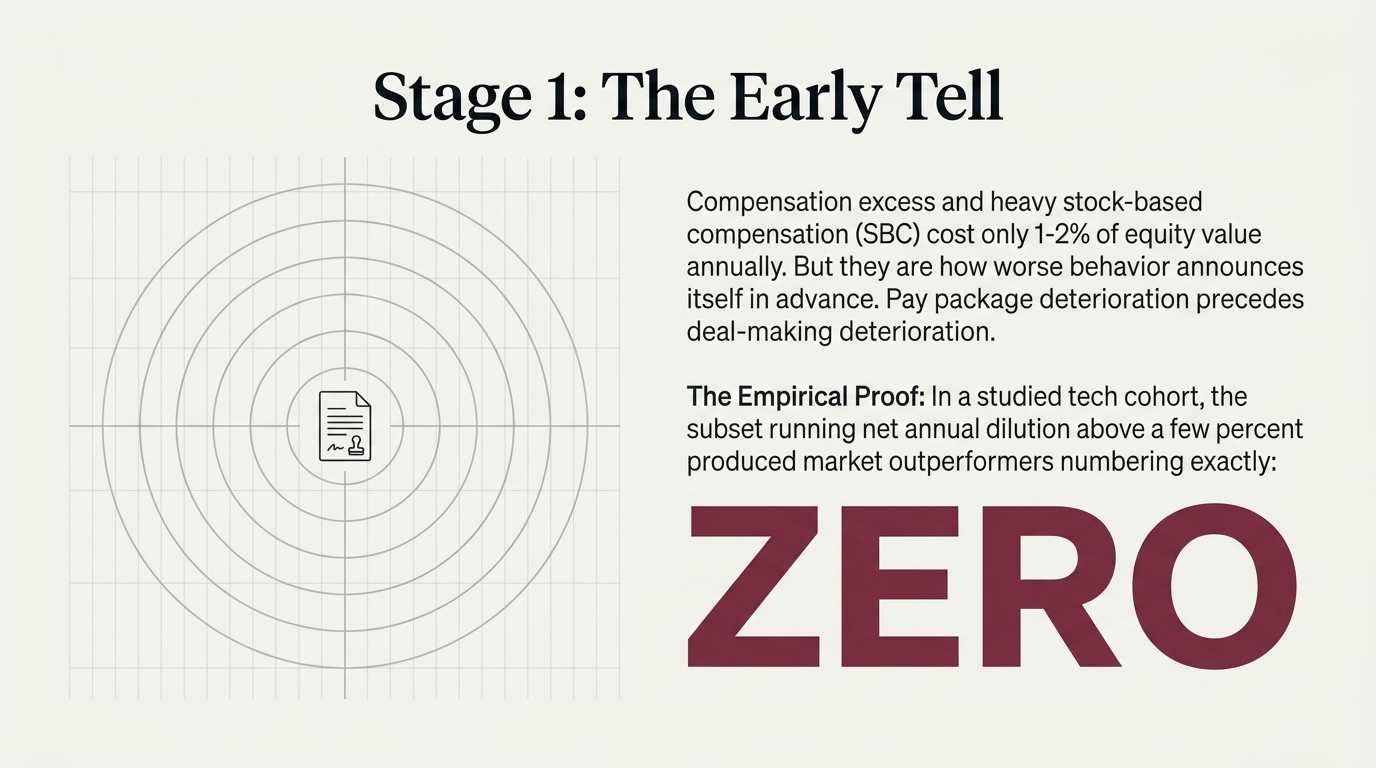
Compensation excess is the mildest mode and the most informative. Its direct cost is small — typically one or two percent of equity value a year. Its signal value is enormous: outsized pay and heavy stock-based compensation are how worse behavior announces itself in advance, in the proxy statement, years before it shows up in a deal announcement. The dilution evidence is brutal. In a studied tech cohort, the subset running net annual dilution above a few percent produced zero market outperformers. Not few. Zero.
Passive drift is the quiet middle mode: no destructive act you can point to, just capital accumulating without a plan, or capex creeping while the returns on it sag. Richardson documented the mechanism — overinvestment rises sharply exactly when free cash flow is abundant — and Cooper, Gulen and Schill showed the consequence: the highest asset-growth firms underperform for years. Masulis quantified the governance version, with entrenched-management firms lagging well-governed ones by a measurable annual spread. Drift doesn't blow up. It compounds slower, forever.
Acquisition overpayment is where real destruction starts, and it is behavioral rather than random. Moeller, Schlingemann and Stulz put a number on it: large acquirers destroyed roughly a quarter-trillion dollars of shareholder value in a single merger wave. Acquirers exhibit win-stay, lose-shift reinforcement, so a CEO whose last deal was applauded is more likely to overpay on the next one.
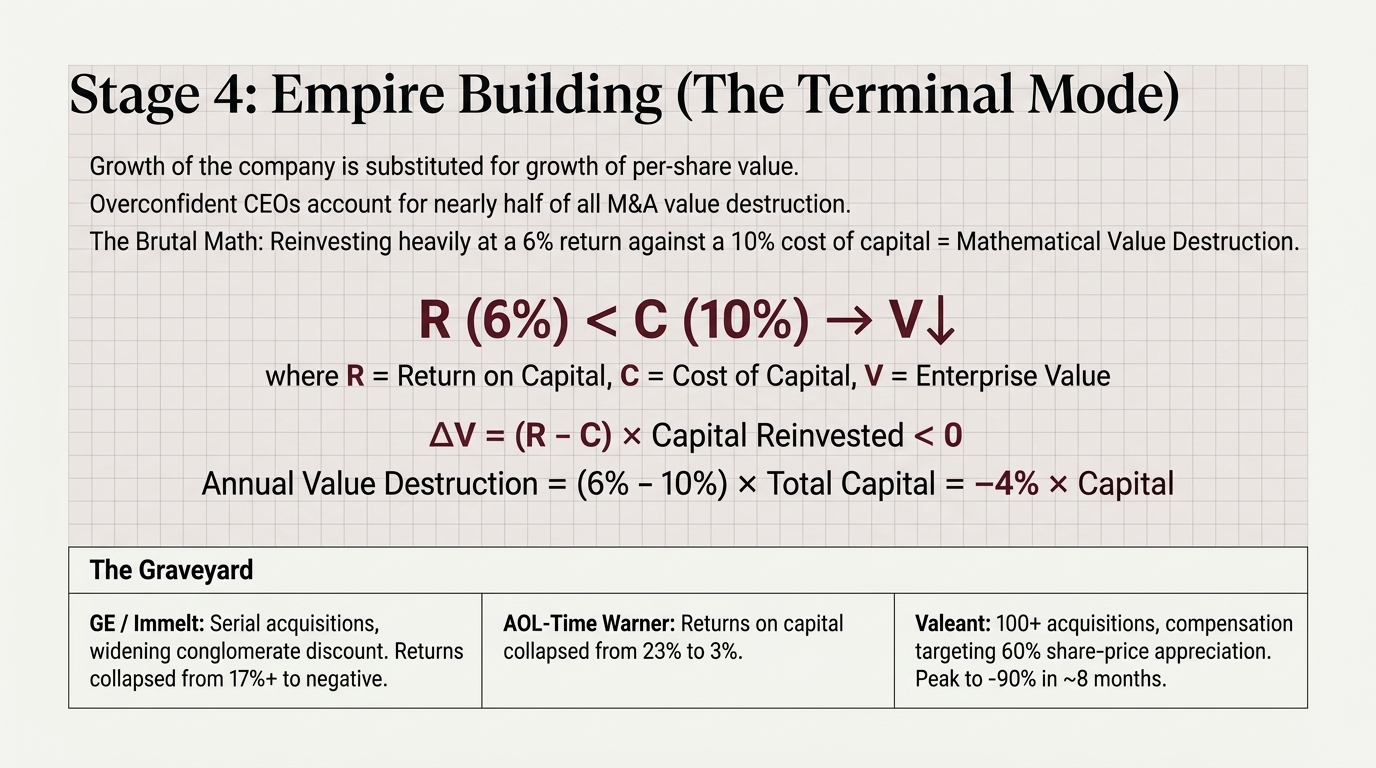
Empire building is the terminal mode — serial diversifying acquisitions at premium prices, growth of the company substituted for growth of per-share value. Malmendier and Tate showed overconfident CEOs do more deals with systematically worse announcement returns, and the concentration is stark: a small minority of CEOs accounts for nearly half of all M&A value destruction. The arithmetic is unforgiving. Reinvesting heavily at a 6% return when capital costs 10% makes a business worth less than one that never grew at all. The canonical cases wrecked world-class franchises — GE under Immelt, with returns falling from 17%+ to negative; AOL-Time Warner, returns on capital from 23% to 3%; Valeant, 100+ acquisitions and a compensation plan targeting 60% share-price appreciation, then peak to −90% in about eight months.
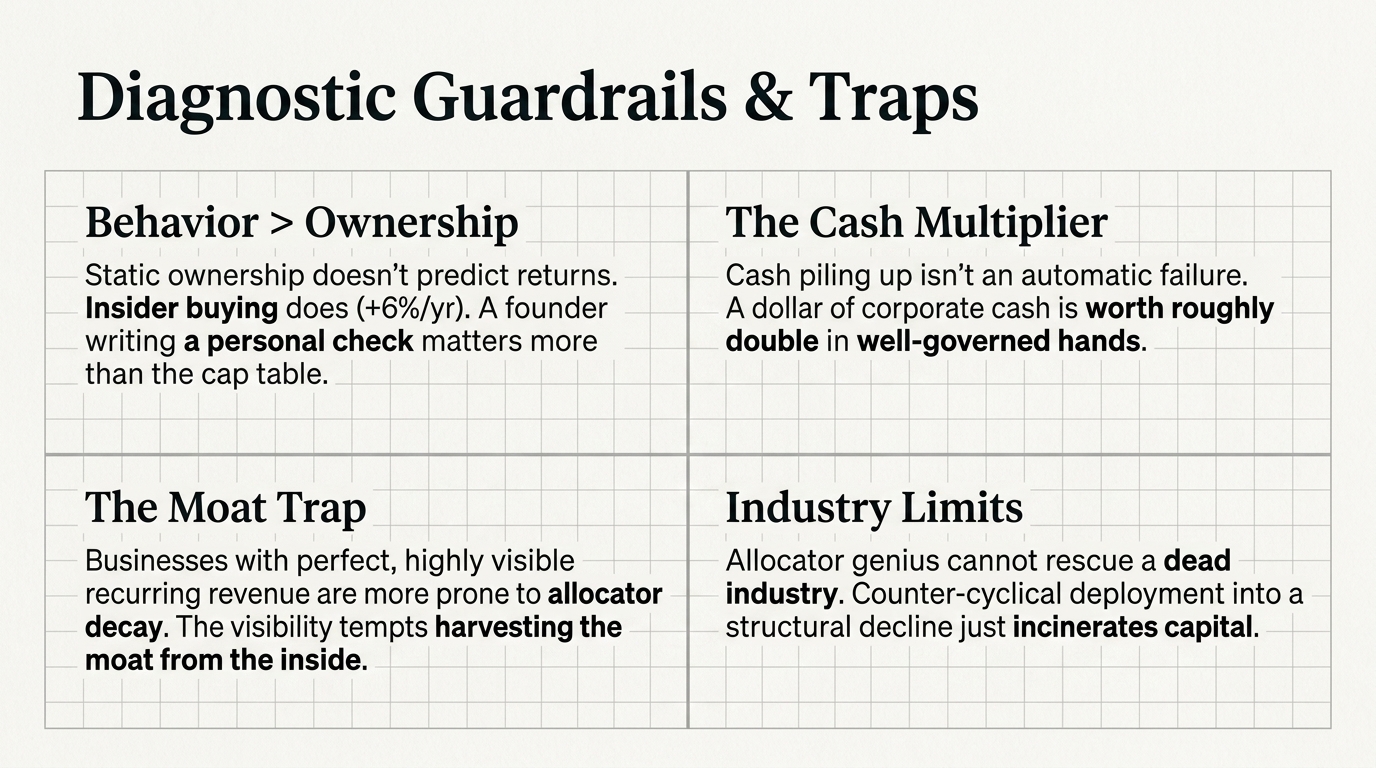
Four guardrails keep the diagnosis honest. Judge behavior, not ownership: static insider ownership percentage does not predict returns, but insider buying carries several points of annual abnormal return, so a founder writing a large personal check after a drawdown says more than any ownership table. Cash piling up is not automatically a failure — Dittmar and Mahrt-Smith found a dollar of corporate cash is worth roughly double in well-governed hands. Allocator quality cannot rescue a dead industry; counter-cyclical genius deployed into a structural decline just incinerates capital. And comp-based tells calibrate differently across sectors — heavy stock compensation means something different in a pre-profit software firm than in an industrial — so thresholds don't transfer mechanically.
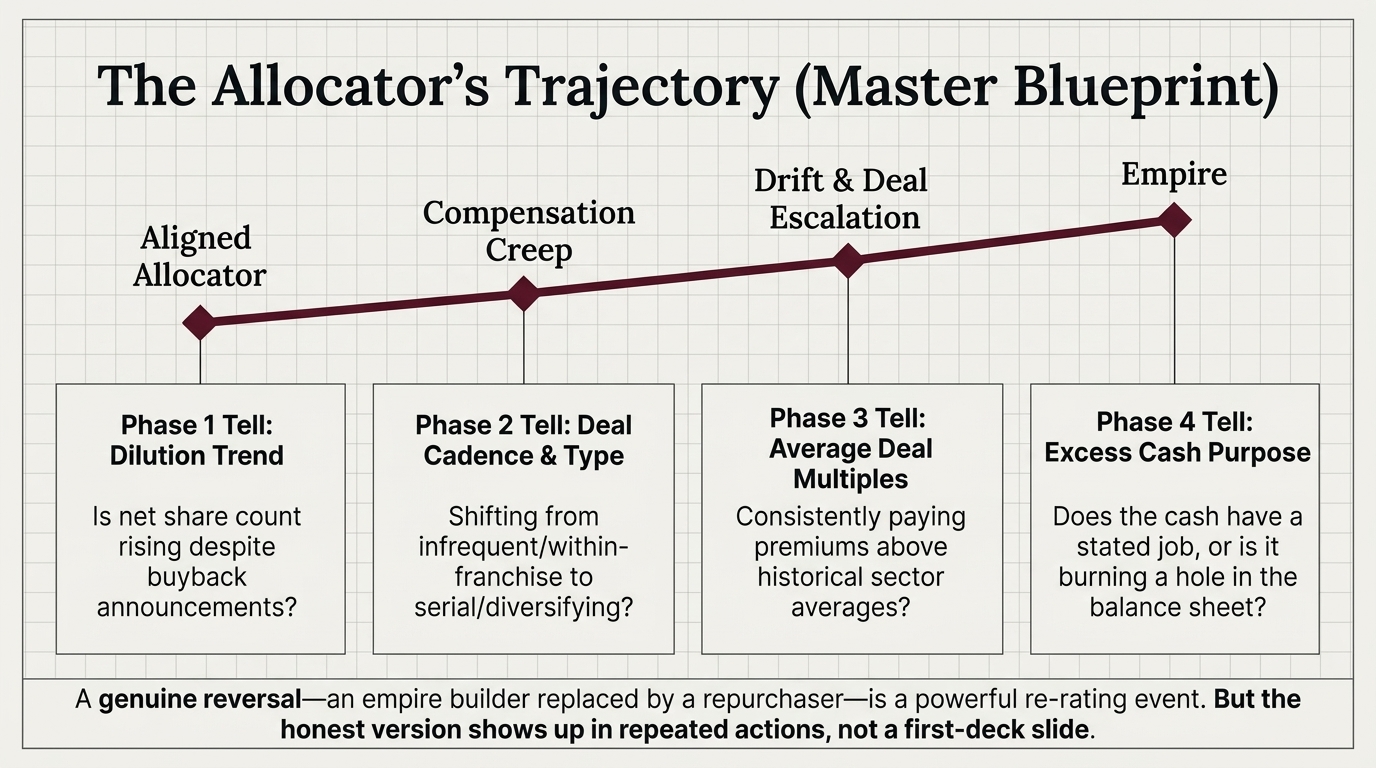
The modes are a sequence, not static bins, and it usually runs one way: aligned allocator, then compensation creep, then drift or escalating deal-making, then empire. That is why the pay package matters more than its direct cost — compensation excess without other misallocation is an early-stage warning about where the allocator is heading. The observable markers are dilution trend, deal cadence, deal type (within-franchise versus diversifying), average deal multiples, and whether excess cash has a stated job. One trap deserves its own sentence: businesses with highly visible recurring revenue are more prone to allocator decay, not less — perfect revenue visibility is exactly what tempts management to harvest the moat from the inside.
Every empire case above looked like bold leadership at announcement. The proxy statement told the truth years earlier.
The reverse transition is real but slow. A genuine allocator change — a Singleton-style repurchaser replacing an empire builder — is one of the most powerful re-rating events in markets, and one of the most faked. The honest version shows up in actions repeated across quarters, not in a capital-allocation slide in the first investor deck.
Sources
Thorndike, The Outsiders; Malmendier & Tate, "Who Makes Acquisitions? CEO Overconfidence and the Market's Reaction" (2008); Moeller, Schlingemann & Stulz, "Wealth Destruction on a Massive Scale" (2005); Masulis, Wang & Xie, "Corporate Governance and Acquirer Returns" (2007); Richardson, "Over-investment of Free Cash Flow" (2006); Cooper, Gulen & Schill, "Asset Growth and the Cross-Section of Stock Returns" (2008); Fahlenbrach, "Founder-CEOs, Investment Decisions, and Stock Market Performance" (2009); Fahlenbrach & Stulz on insider ownership; Jeng, Metrick & Zeckhauser (insider trading returns); Bharath, Cho & Choi (win-stay, lose-shift); Dittmar & Mahrt-Smith, "Corporate Governance and the Value of Cash Holdings" (2007); Damodaran (the growth and value-destruction arithmetic); Bain & Co. (counter-cyclical deployment returns); Yardeni and Federal Reserve data (buybacks versus stock compensation); Buffett/Berkshire letters (the retained-earnings test, post-Lehman deployment); public financials of the named cases — Teledyne, Capital Cities, AutoZone, NVR, Dillard's, GE, AOL-Time Warner, Valeant, Pitney Bowes.
Not AI-generated signals.
Get the next piece by email.
One email when new research publishes. No spam, no tipsheet.
One email when a new piece publishes. No spam.
Published 26 Jul 2026 and not revised since. Informational only — not investment advice or a recommendation. Corrections: research@863labs.com.